Metrics and dashboards
Last updated: 9/4/2020Table of contents
Site overview
The dashboard below gives details of arup.com's overall performance in 2018. it includes a breakdown of key content types such as projects, perspectives and expertise pages.
Global marketing expertise performance
The dashboard below gives high-level details of the 'expertise' pages covered by Global marketers.
Accessing detailed reports
Click on your preferred report below to access more detailed analytics information about arup.com.
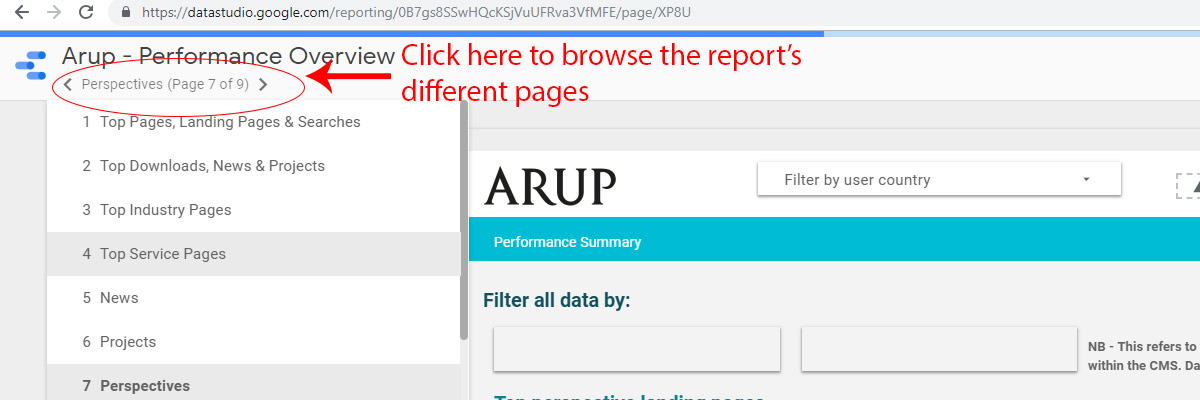
These reports contain a range of information inluding an 'overview' of the subject as well as a focus on more specific areas for example projects or perspectives. These reports are spread over multiple pages. Once you've loaded your report, you can browse the different pages by clicking underneath the report's title and choosing the page that's relevant to your interest.
Local reports
Global reports
- Ongoing monthly reporting - provides an overview of web and social performance
- 2019 performance review - report providing an overall peformance review of arup.com in 2018. Non filterable.
Global marketer reports
Reports below all include live data and can be filtered by date.
- Advisory services report - overview of the Advisory Services page (NOTE: excludes individual services)
- Aviation report - overview of Aviation industry area and associated projects
- Cities report - overview of Cities industry area and associated projects and perspectives
- Digital report - overview of Digital performance including Shaping the Connected World page, Digital service page and associated projects and perspectives
- Energy report - overview of Energy expertise section, and associated projects and perspectives
- Highways report - overview of Highways industry page and associated projects
- Rail report - overview of the Rail industry page and associated projects
- Water report - overview of the Water industry page and associated projects
Regional reports
Reports below all include live data and show the previous month's data (for example viewing the dashboard in the month of April means you're seeing data from 1 - 31 March).